Momentum Is Building for New Home Construction

Momentum Is Building for New Home Construction.

If you’re in the process of looking for a home today, you know the supply of homes for sale is low because you’re feeling the impact of having a limited pool of options. And, if your biggest hurdle right now is that you’re having trouble finding something you like, don’t forget that a newly built home is a great option.

As a recent article from the National Association of Realtors (NAR) says

Home buyers continue to be met with limited housing options during what’s typically the real estate market’s busiest season. . . . The current supply of existing homes is about half the level it was in 2019 . . . Meanwhile, the market for new construction is a bright spot.”

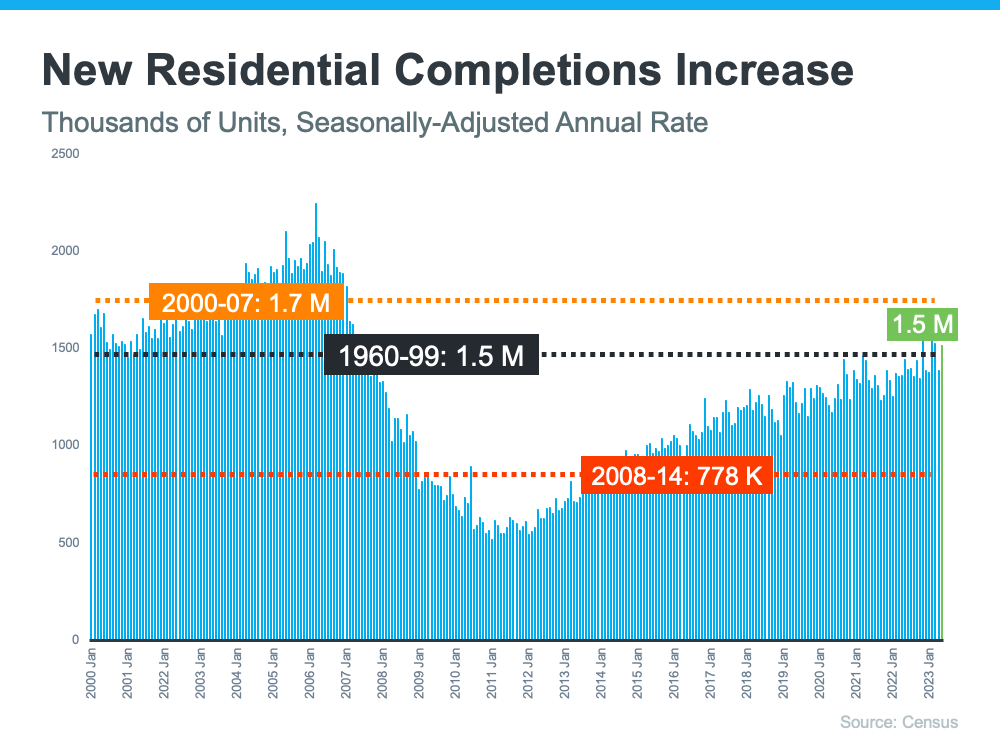
Here’s a look at a key metric that shows just how much new home construction is ramping up nationwide. It’s called new residential completions. Basically, completions are newly built homes that are finished and ready to move into.

The graph below uses data from the Census to show the trend of new-home completions over time, including the long-term average for the number of finished housing units (shown in black on the graph):

As you can see on the left (shown in orange), leading up to the housing crash, builders exceeded that average. The result was an oversupply of homes on the market, so home values declined. That was one of the factors that led to the housing crash back in 2008.

Since then, the level of new home construction has fallen off, and builders haven’t built enough homes to meet the historical average (shown in red). That underbuilding left the housing market with a multi-year inventory deficit. And, that deficit is part of what makes inventory so low right now.

But, here’s the good news. The green on the right shows that according to the latest report from the Census, builders are matching the long-term average right now. And that means they’re bringing more newly built homes to the market than they have in recent memory.

And residential starts and permits are also gaining momentum. Starts are homes where the construction has officially kicked off. Permits are homes where builders are planning to break ground soon. Since both are up, it’s a sign there are even more newly built homes coming soon.

What This Means for You

More newly built homes in various stages of the construction process means your pool of options just got bigger. If you’re looking to move right now and timing is important to you, reach out to a local real estate professional to explore the homes that were recently completed in your area. If construction is done on those homes, you should be able to move in quickly.

But, if you can wait a bit and the idea of customizing a home from the ground up appeals to you, ask that same agent about the homes in your area that are in the process of being built. If you buy a home that’s still in the works, you can help pick the features and finishings along the way. And when none of the homes you’ve looked at so far are to your liking, being able to tailor one to your taste may be your best option.

Either way, a trusted real estate agent is a crucial part of the process. They’ll know exactly what’s available in your area and can base their recommendations on your unique needs, desired neighborhoods, and more.

Bottom Line

So, if you’re having trouble finding a home you like while inventory is so low, it may be time to consider looking into new-home construction. If you’d like to start that conversation, reach out to a trusted local real estate professional who’s an expert on what’s available in your area.

Comments Off on Momentum Is Building for New Home Construction

Today’s Housing Inventory Is a Sweet Spot for Sellers

Today’s Housing Inventory Is a Sweet Spot for Sellers.

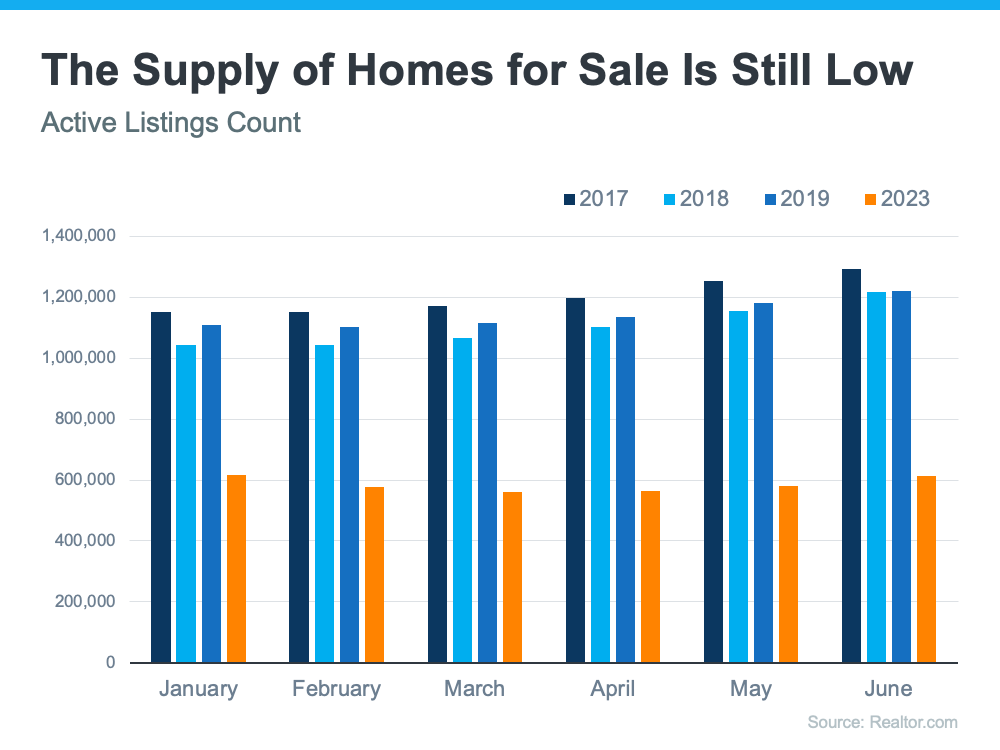
One of the biggest challenges in the housing market right now is how few homes there are for sale compared to the number of people who want to buy them. To help emphasize just how limited housing inventory still is, let’s take a look at the latest information on active listings, or homes for sale in a given month, as it compares to more normal levels.

According to a recent report from Realtor.com

 “On average, active inventory in June was 50.6% below pre-pandemic 2017–2019 levels.”

The graph below helps illustrate this point. It uses historical data to provide a more concrete look at how much the numbers are still lagging behind the level of inventory typical of a more normal market (see graph below):

It’s worth noting that 2020-2022 are not included in this graph. That’s because they were truly abnormal years for the housing market. To make the comparison fair, those have been omitted so they don’t distort the data.

When you compare the orange bars for 2023 with the last normal years for the housing market (2017-2019), you can see the count of active listings is still far below the norm.

What Does This Mean for You? 

If you’re thinking about selling your house, that low inventory is why this is a great time to do so. Buyers have fewer choices now than they did in more normal years, and that’s continuing to impact some key statistics in the housing market. For example, sellers will be happy to see the following data from the latest Confidence Index from the National Association of Realtors (NAR):

  • The percent of homes that sold in less than a month ticked up slightly to 74%. 
  • The median days on market went down to 18 days, showing homes are still selling fast when priced right. 
  • The average number of offers on recently sold homes went up to 3.3 offers.

Bottom Line

When supply is so low, your house is going to be in the spotlight. That’s why sellers are seeing their homes sell a little faster and get more offers right now. If you’ve thought about selling, now’s the time to make a move. Connect with a trusted real estate professional to get the process started.

Comments Off on Today’s Housing Inventory Is a Sweet Spot for Sellers

Americans Still View Homeownership as the American Dream

Americans Still View Homeownership as the American Dream.

Everyone’s interpretation of the American Dream is unique and personal. But, for many people, it’s tied to a sense of success, freedom, and prosperity. These are all things that owning a home can help provide.

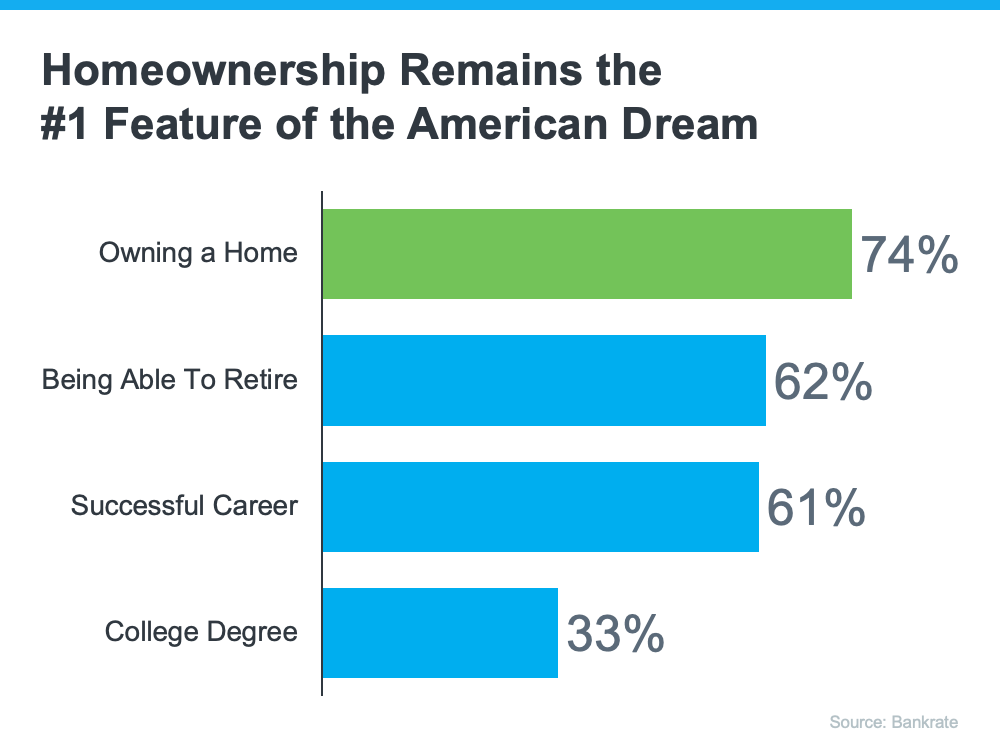
A recent survey from Bankrate asked respondents which achievements they feel most embody the American Dream. The responses prove owning a home is still important to so many Americans today (see graph below):

As the graph shows, homeownership ranks above other significant milestones, including retirement, having a successful career, and earning a college degree.

A recent report from MYND helps shed light on why so many people value homeownership. It finds:

“. . . nearly two-thirds of Americans (65%) see homeownership as a means of building intergenerational wealth.

That’s because, when you own a home, your equity (and net worth) grows over time as you pay down your home loan and as home prices appreciate. This can be a key factor in building intergenerational wealth and long-term financial stability.

To further drive home the difference homeownership can make in your life, a report from Fannie Mae says:

“Most consumers (87%) believe owning a home is important to ‘live the good life.’ . . . Notably, significantly more see ‘having less stress’ as a benefit achieved by owning than renting.”

Especially today, this could be because, when you own a home with a fixed-rate mortgage, you stabilize what’s likely your largest monthly expense (your housing cost), and that helps combat the impact of rising costs from inflation.

What Does This Mean for You?

While it may feel challenging to buy a home today with higher mortgage rates and home prices, if the time is right for you, know that when you buy a home, incredible benefits are waiting for you at the end of your journey.

Bottom Line

Buying a home is a significant and powerful choice, embodying the foundation of the American Dream. If you plan to make your homeownership dream a reality this year, take the first step by reaching out to a local real estate expert and start the process today.

Comments Off on Americans Still View Homeownership as the American Dream

Lending Standards Are Not Like They Were Leading Up to the Crash

Lending Standards Are Not Like They Were Leading Up to the Crash.

You might be worried we’re heading for a housing crash, but there are many reasons why this housing market isn’t like the one we saw in 2008. One of which is how lending standards are different today. Here’s a look at the data to help prove it. 

Every month, the Mortgage Bankers Association (MBA) releases the Mortgage Credit Availability Index (MCAI). According to their website:

“The MCAI provides the only standardized quantitative index that is solely focused on mortgage credit. The MCAI is . . . a summary measure which indicates the availability of mortgage credit at a point in time.”

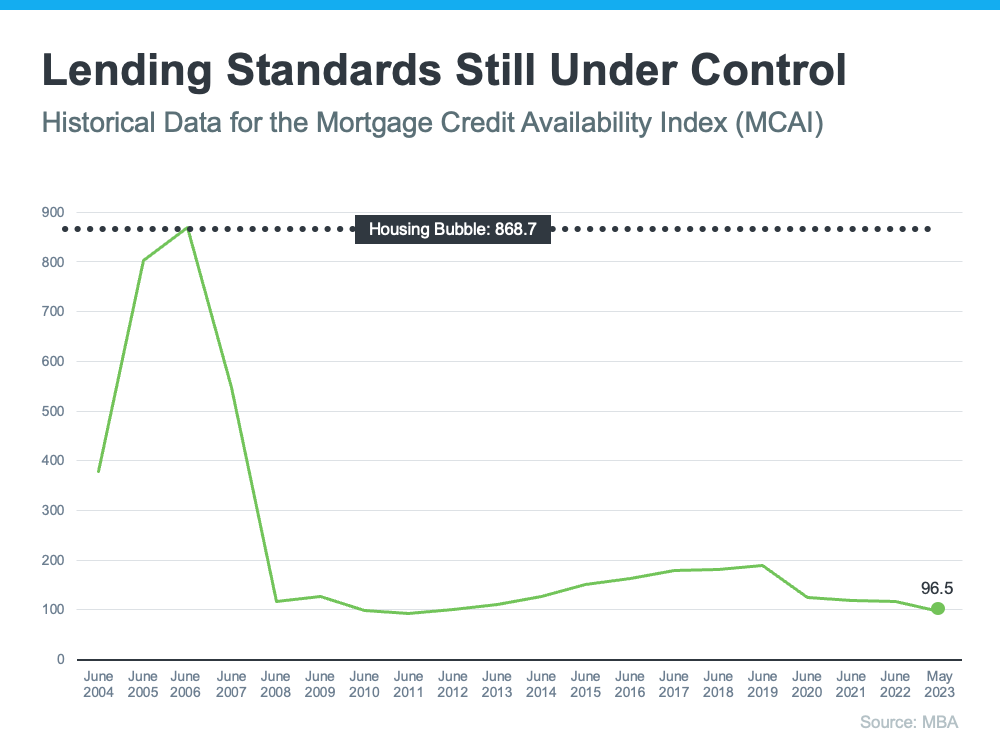
Basically, the index determines how easy it is to get a mortgage. Take a look at the graph below of the MCAI since they started keeping track of this data in 2004. It shows how lending standards have changed over time. It works like this: 

  • When lending standards are less strict, it’s easier to get a mortgage, and the index (the green line in the graph) is higher.
  • When lending standards are stricter, it’s harder to get a mortgage, and the line representing the index is lower.

In 2004, the index was around 400. But, by 2006, it had gone up to over 850. Today, the story is quite different. Since the crash, the index went down because lending standards got tighter, so today it’s harder to get a mortgage.

Loose Lending Standards Contributed to the Housing Bubble

One of the main factors that contributed to the housing bubble was that lending standards were a lot less strict back then. Realtor.com explains it like this: 

“In the early 2000s, it wasn’t exactly hard to snag a home mortgage. . . . plenty of mortgages were doled out to people who lied about their incomes and employment, and couldn’t actually afford homeownership.” 

The tall peak in the graph above indicates that leading up to the housing crisis, it was much easier to get credit, and the requirements for getting a loan were far from strict. Back then, credit was widely available, and the threshold for qualifying for a loan was low.

Lenders were approving loans without always going through a verification process to confirm if the borrower would likely be able to repay the loan. That means creditors were lending to more borrowers who had a higher risk of defaulting on their loans.

Today’s Loans Are Much Tougher To Get than Before

As mentioned, lending standards have changed a lot since then. Bankrate describes the difference: 

“Today, lenders impose tough standards on borrowers – and those who are getting a mortgage overwhelmingly have excellent credit.”

If you look back at the graph, you’ll notice after the peak around the time of the housing crash, the line representing the index went down dramatically and has stayed low since. In fact, the line is far below where standards were even in 2004 – and it’s getting lower. Joel Kan, VP and Deputy Chief Economist at MBA, provides the most recent update from May:

“Mortgage credit availability decreased for the third consecutive month . . . With the decline in availability, the MCAI is now at its lowest level since January 2013.”

The decreasing index suggests standards are getting much tougher – which makes it clear we’re far away from the extreme lending practices that contributed to the crash.

Bottom Line

Leading up to the housing crash, lending standards were much more relaxed with little evaluation done to measure a borrower’s potential to repay their loan. Today, standards are tighter, and the risk is reduced for both lenders and borrowers. This goes to show, these are two very different housing markets, and this market isn’t like the last time.

Comments Off on Lending Standards Are Not Like They Were Leading Up to the Crash

Eco-Friendly, Energy-Efficient Homes Attract Buyers

Eco-Friendly, Energy-Efficient Homes Attract Buyers.

Are you planning to sell your house? If so, you may be surprised to hear just how much buyers value energy efficiency and eco-friendly features today. This is especially true as summer officially kicks off.

In fact, the 2023 Realtors and Sustainability Report from the National Association of Realtors (NAR) shows 48% of agents or brokers have noticed consumers are interested in sustainability.

 So, if you’re considering selling your house, why does this matter to you? It helps you know what you can do to make your house even more appealing to today’s buyers. According to Jessica Lautz, Deputy Chief Economist and VP of Research at NAR: 

“Buyers often seek homes that either lessen their environmental footprint or reduce their monthly energy costs. There is value in promoting green features and energy information to future home buyers.”

Consider Upgrading Your Home To Make It More Appealing

If you want to upgrade your house in a way that maximizes its green appeal, you need to work with a local agent to understand what buyers in your area are looking for. The same NAR report identifies the following green home features as most important to buyers at a national level: 

  • Windows, doors, and siding
  • Proximity to frequently visited places
  • A comfortable living space
  • A home’s utility bills and operating costs

While you can’t change the location of your house, you can take action to make sure it’s as comfortable as possible while also setting up the next owners for lower operating costs. ENERGY STAR shares some suggested upgrades as ones that may be worth considering:

  • Heating and cooling: Ensure your HVAC system is properly maintained and regularly serviced to maximize its efficiency. Consider upgrading to a high-efficiency model, if needed.
  • Water heater: Your water heater uses a lot of energy. Upgrading to a heat pump water heater can significantly reduce energy consumption and appeal to environmentally conscious buyers.
  • Smart thermostat: A big part of your energy bill goes to heating and cooling. Install a programmable thermostat to better regulate temperature settings. This not only enhances comfort but can also lower energy usage.
  • Attic insulation: Proper sealing and insulation in your attic help prevent air leaks and maintain a comfortable temperature, reducing the strain on heating and cooling systems.
  • Energy-efficient windows: Replacing old, drafty windows with energy-efficient ones can minimize heat transfer and lower your energy bills.

 It’s worth noting that you may be able to take advantage of tax credits and rebates for energy-efficient home installations and upgrades. These incentives could help offset a portion of the costs associated with eco-friendly home improvements.

As you prepare to sell your house, it’s important to recognize that real estate agents are valuable resources. They can help you determine which upgrades would be most appealing for buyers in your area and provide guidance on which green features to highlight in your listing. If you’ve already made these updates recently, tell your agent so they can feature them in your listing.

Bottom Line

Focusing on energy efficiency and eco-friendly features can help make your house more appealing to buyers today. Connect with a local real estate agent to ensure you’re choosing the right upgrades for your area.

Comments Off on Eco-Friendly, Energy-Efficient Homes Attract Buyers

Why the Median Home Price Is Meaningless in Today’s Market

Why the Median Home Price Is Meaningless in Today’s Market.

The National Association of Realtors (NAR) will release its latest Existing Home Sales (EHS) report later this week. This monthly report provides information on the sales volume and price trend for previously owned homes. In the upcoming release, it’ll likely say home prices are down. This may feel a bit confusing, especially if you’ve been following along and seeing the blogs saying that home prices have bottomed out and turned a corner.

So, why will this likely say home prices are falling when so many other price reports say they’re going back up? It all depends on the methodology of each report. NAR reports on the median sales price, while some other sources use repeat sales prices. Here’s how those approaches differ.

The Center for Real Estate Studies at Wichita State University explains median prices like this:

The median sale price measures the ‘middle’ price of homes that sold, meaning that half of the homes sold for a higher price and half sold for less . . . For example, if more lower-priced homes have sold recently, the median sale price would decline (because the “middle” home is now a lower-priced home), even if the value of each individual home is rising.”

Investopedia helps define what a repeat sales approach means:

Repeat-sales methods calculate changes in home prices based on sales of the same property, thereby avoiding the problem of trying to account for price differences in homes with varying characteristics.”

The Challenge with the Median Sales Price Today

As the quotes above say, the approaches can tell different stories. That’s why median price data (like EHS) may say prices are down, even though the vast majority of the repeat sales reports show prices are appreciating again.

Bill McBride, Author of the Calculated Risk blog, sums the difference up like this:

“Median prices are distorted by the mix and repeat sales indexes like Case-Shiller and FHFA are probably better for measuring prices.”

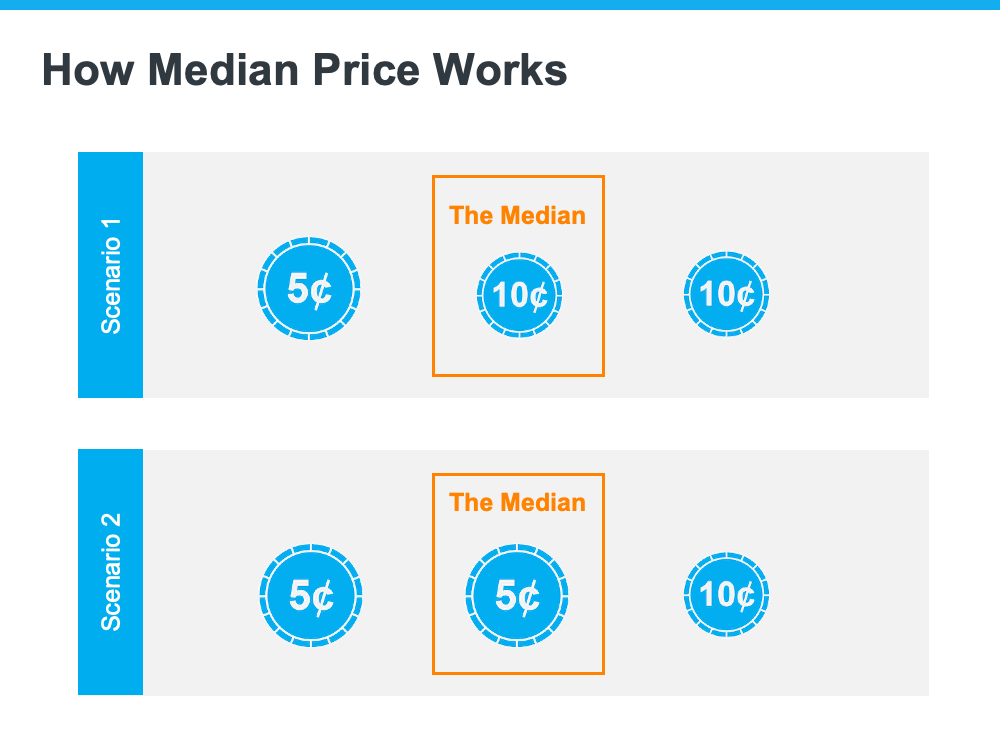
To drive this point home, here’s a simple explanation of median value (see visual below). Let’s say you have three coins in your pocket, and you decide to line them up according to their value from low to high. If you have one nickel and two dimes, the median value (the middle one) is 10 cents. If you have two nickels and one dime, the median value is now five cents.

In both cases, a nickel is still worth five cents and a dime is still worth 10 cents. The value of each coin didn’t change.

That’s why using the median home price as a gauge of what’s happening with home values isn’t worthwhile right now. Most buyers look at home prices as a starting point to determine if they match their budgets. But, most people buy homes based on the monthly mortgage payment they can afford, not just the price of the house. When mortgage rates are higher, you may have to buy a less expensive home to keep your monthly housing expense affordable. A greater number of ‘less-expensive’ houses are selling right now for this exact reason, and that’s causing the median price to decline. But that doesn’t mean any single house lost value. 

When you see the stories in the media that prices are falling later this week, remember the coins. Just because the median price changes, it doesn’t mean home prices are falling. What it means is the mix of homes being sold is being impacted by affordability and current mortgage rates.

Bottom Line

For a more in-depth understanding of home price trends and reports, reach out to a local real estate professional.

Comments Off on Why the Median Home Price Is Meaningless in Today’s Market

A Drop in Equity Doesn’t Mean Low Equity

A Drop in Equity Doesn’t Mean Low Equity.

You may see media coverage talking about a drop in homeowner equity. What’s important to understand is that equity is tied closely to home values. So, when home prices appreciate, you can expect equity to grow. And when home prices decline, equity does too. Here’s how this has played out recently. 

Home prices rose rapidly during the ‘unicorn’ years. That gave homeowners a considerable equity boost. But those ‘unicorn’ years couldn’t last forever. The market had to moderate at some point, and that’s what we saw last fall and winter. 

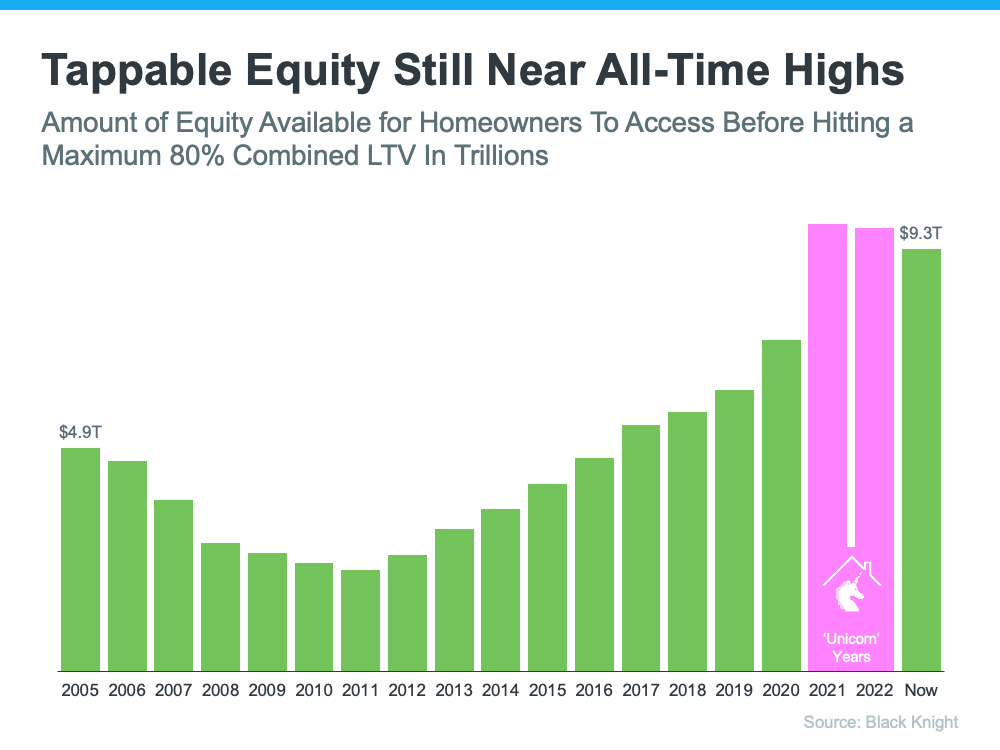
As home prices dropped slightly in the back half of 2022, equity was impacted. Based on the most recent report from CoreLogic, there was a 0.7% dip in homeowner equity over the last year. However, the headlines reporting on that change aren’t painting the whole picture. The reality is, while home price depreciation during the second half of last year caused equity to drop, the data shows homeowners still have near record amounts of equity

The graph below helps illustrate this point by looking at the total amount of tappable equity in this country going all the way back to 2005. Tappable equity is the amount of equity available for homeowners to access before hitting a maximum 80% loan-to-value ratio (LTV). As the data shows, there was a significant equity boost during the ‘unicorn’ years as home prices rapidly appreciated (see the pink in the graph below).

But here’s what’s key to realize – even though there’s been a small dip, total homeowner equity is still much higher than it was before the ‘unicorn’ years.

And there’s more good news. Recent home price reports show the worst home price declines are behind us, and prices have started to go up again. As Selma Hepp, Chief Economist at CoreLogic, explains:

“Home equity trends closely follow home price changes. As a result, while the average amount of equity declined from a year ago, it increased from the fourth quarter of 2022, as monthly home prices growth accelerated in early 2023.” 

The last part of that quote is particularly important and is the piece of the puzzle the news is leaving out. To further emphasize the positive turn we’re already seeing, experts say home prices are forecast to appreciate at a more normal rate over the next year. In the same report, Hepp puts it this way:

The average U.S. homeowner now has more than $274,000 in equity – up significantly from $182,000 before the pandemic. Also, while homeowners in some areas of the country who bought a property last spring have no equity as a result of price losses, forecasted home price appreciation over the next year should help many borrowers regain some of that lost equity.”

And even though Odeta Kushi, Deputy Chief Economist at First American, references a slightly different number, Kushi further validates the fact that homeowners have a lot of equity right now: 

“Homeowners today have an average of $302,000 in equity in their homes.”

That means if you’ve owned your home for a few years, you likely still have way more equity than you did before the ‘unicorn’ years. And if you’ve owned your home for a year or less, the forecast for more typical price appreciation over the next year should mean your equity is already on the way back up.

Bottom Line

Context is everything when looking at headlines. While homeowner equity dropped some from last year, it’s still near all-time highs. Reach out to a trusted real estate professional so you can get the answers you deserve from an expert who’s there to help as you plan your move this year.

Comments Off on A Drop in Equity Doesn’t Mean Low Equity

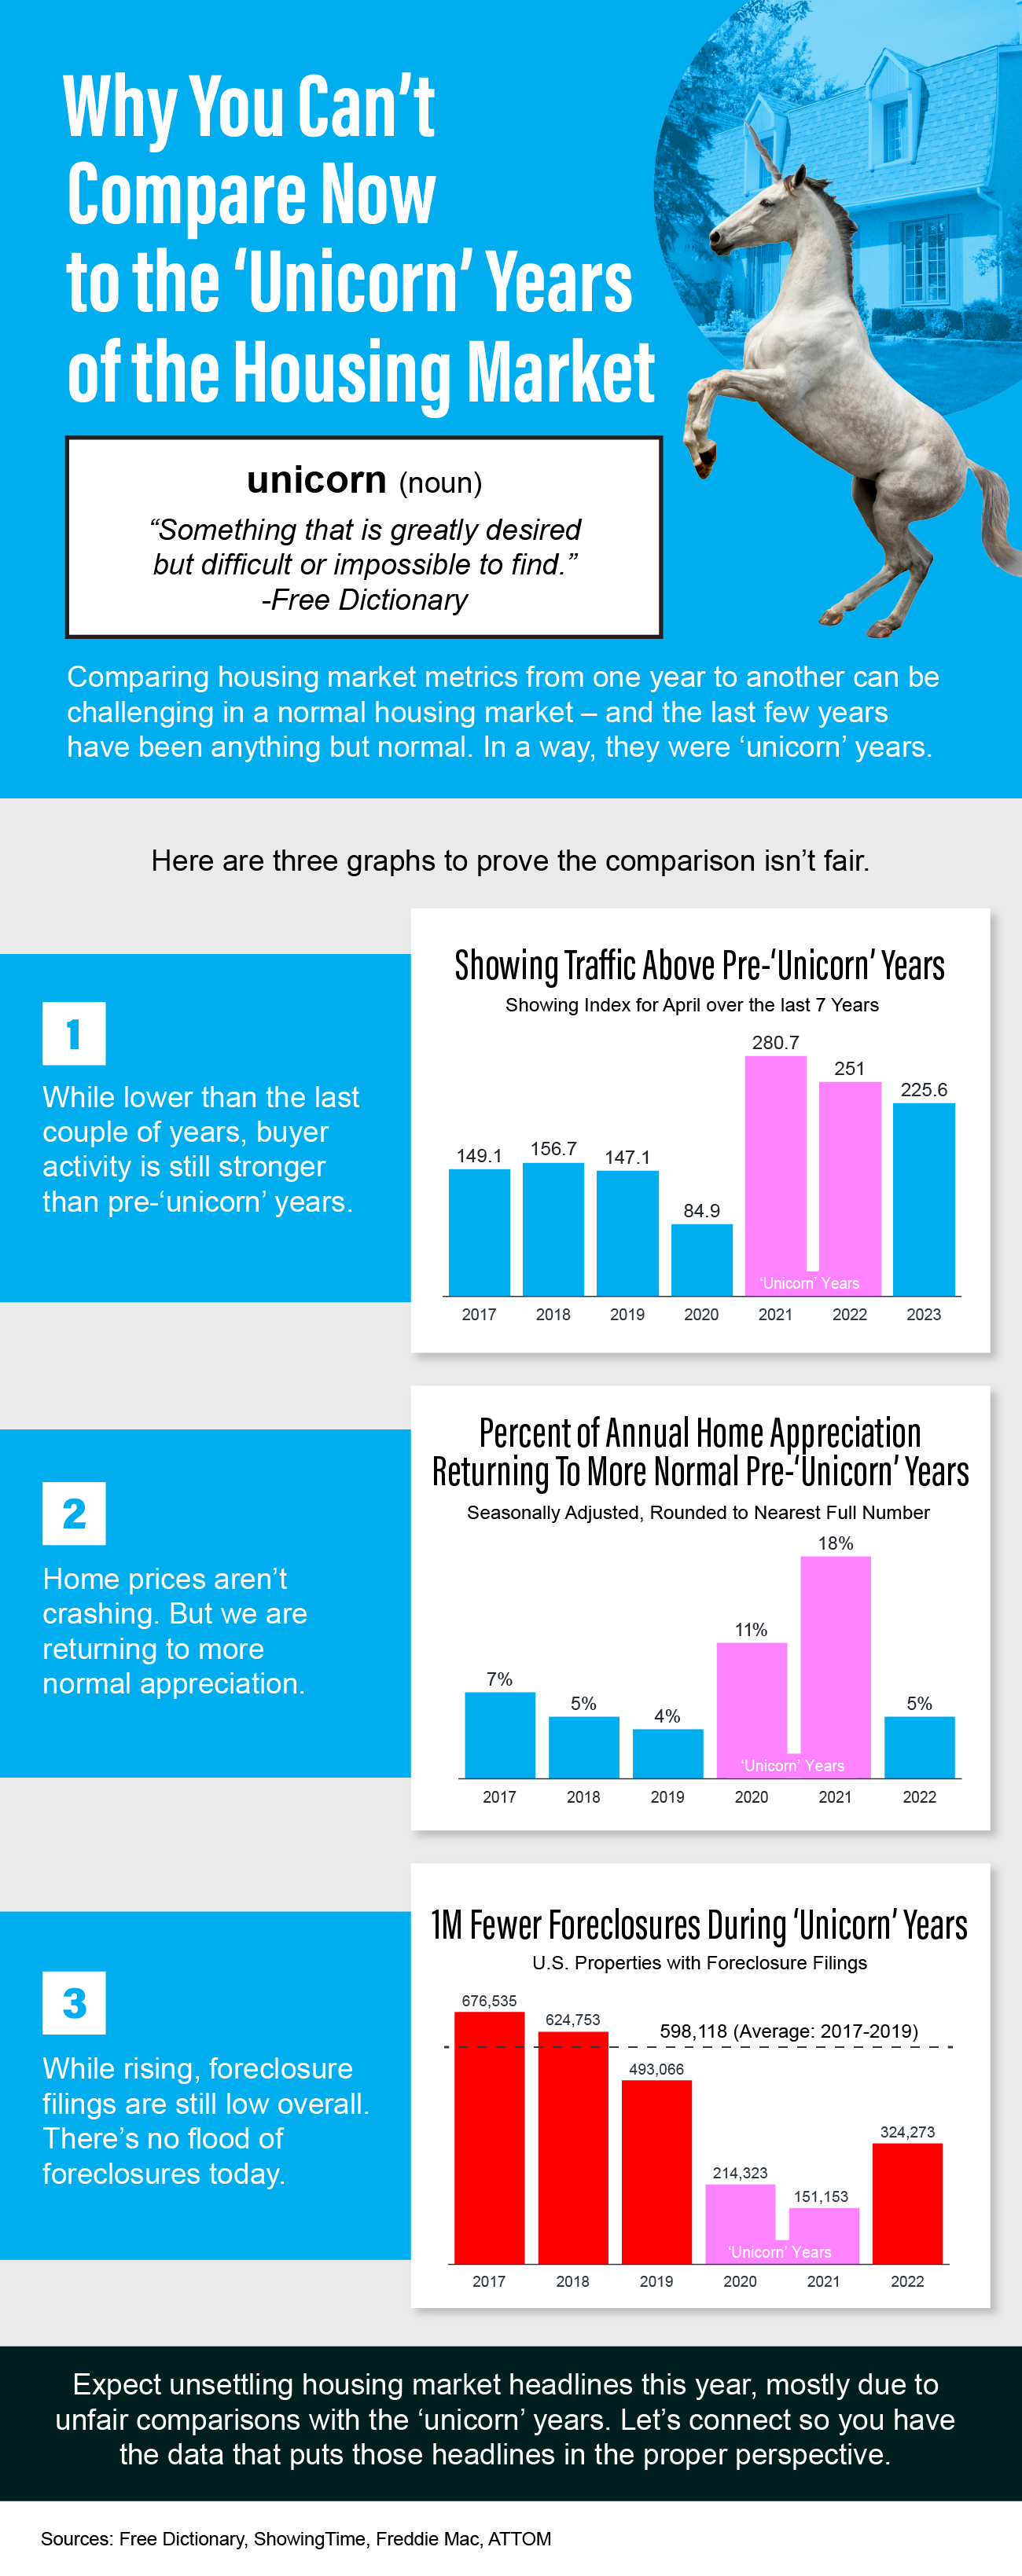
Why You Can’t Compare Now to the ‘Unicorn’ Years of the Housing Market [INFOGRAPHIC]

Why You Can’t Compare Now to the ‘Unicorn’ Years of the Housing Market [INFOGRAPHIC].

Some Highlights

  • Comparing housing market metrics from one year to another can be challenging in a normal housing market – and the last few years have been anything but normal. In a way, they were ‘unicorn’ years.
  • Expect unsettling housing market headlines this year, mostly due to unfair comparisons with the ‘unicorn’ years.
  • Connect with a local real estate professional who can share the data that puts those headlines in the proper perspective.
Comments Off on Why You Can’t Compare Now to the ‘Unicorn’ Years of the Housing Market [INFOGRAPHIC]

Are Home Prices Going Up or Down? That Depends…

Are Home Prices Going Up or Down? That Depends….

Media coverage about what’s happening with home prices can be confusing. A large part of that is due to the type of data being used and what they’re choosing to draw attention to. For home prices, there are two different methods used to compare home prices over different time periods: year-over-year (Y-O-Y) and month-over-month (M-O-M). Here’s an explanation of each. 

Year-over-Year (Y-O-Y):
  • This comparison measures the change in home prices from the same month or quarter in the previous year. For example, if you’re comparing Y-O-Y home prices for April 2023, you would compare them to the home prices for April 2022.
  • Y-O-Y comparisons focus on changes over a one-year period, providing a more comprehensive view of long-term trends. They are usually useful for evaluating annual growth rates and determining if the market is generally appreciating or depreciating.
Month-over-Month (M-O-M):
  • This comparison measures the change in home prices from one month to the next. For instance, if you’re comparing M-O-M home prices for April 2023, you would compare them to the home prices for March 2023.
  • Meanwhile, M-O-M comparisons analyze changes within a single month, giving a more immediate snapshot of short-term movements and price fluctuations. They are often used to track immediate shifts in demand and supply, seasonal trends, or the impact of specific events on the housing market.

The key difference between Y-O-Y and M-O-M comparisons lies in the time frame being assessed. Both approaches have their own merits and serve different purposes depending on the specific analysis required.

Why Is This Distinction So Important Right Now? 

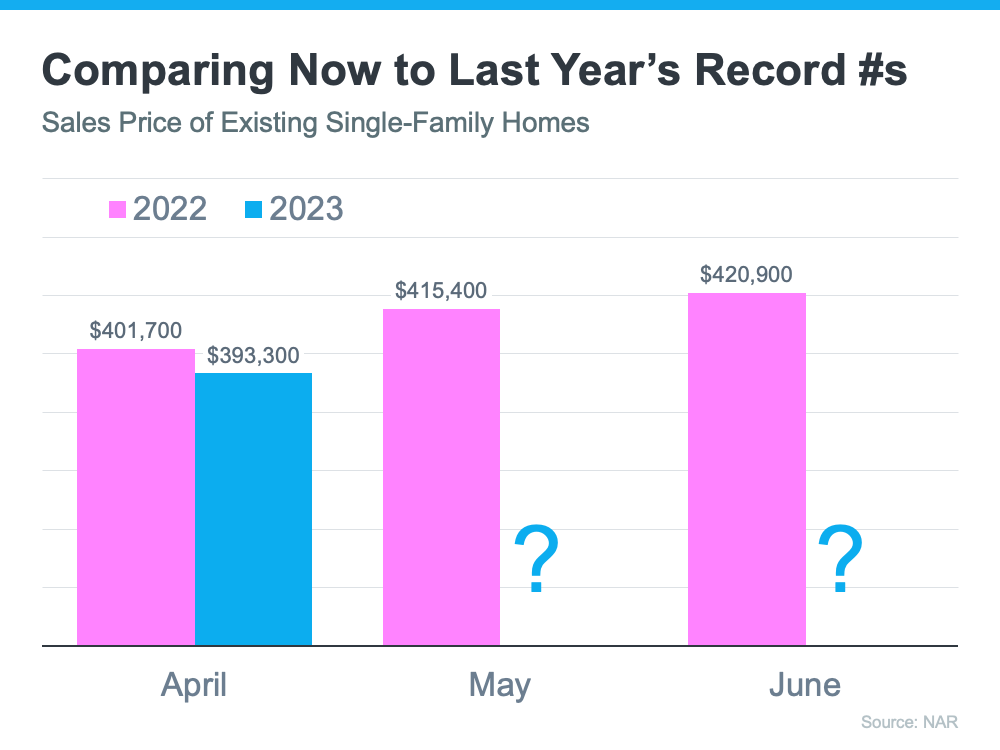
We’re about to enter a few months when home prices could possibly be lower than they were the same month last year. April, May, and June of 2022 were three of the best months for home prices in the history of the American housing market. Those same months this year might not measure up. That means, the Y-O-Y comparison will probably show values are depreciating. The numbers for April seem to suggest that’s what we’ll see in the months ahead (see graph below):

That’ll generate troubling headlines that say home values are falling. That’ll be accurate on a Y-O-Y basis. And, those headlines will lead many consumers to believe that home values are currently cascading downward.

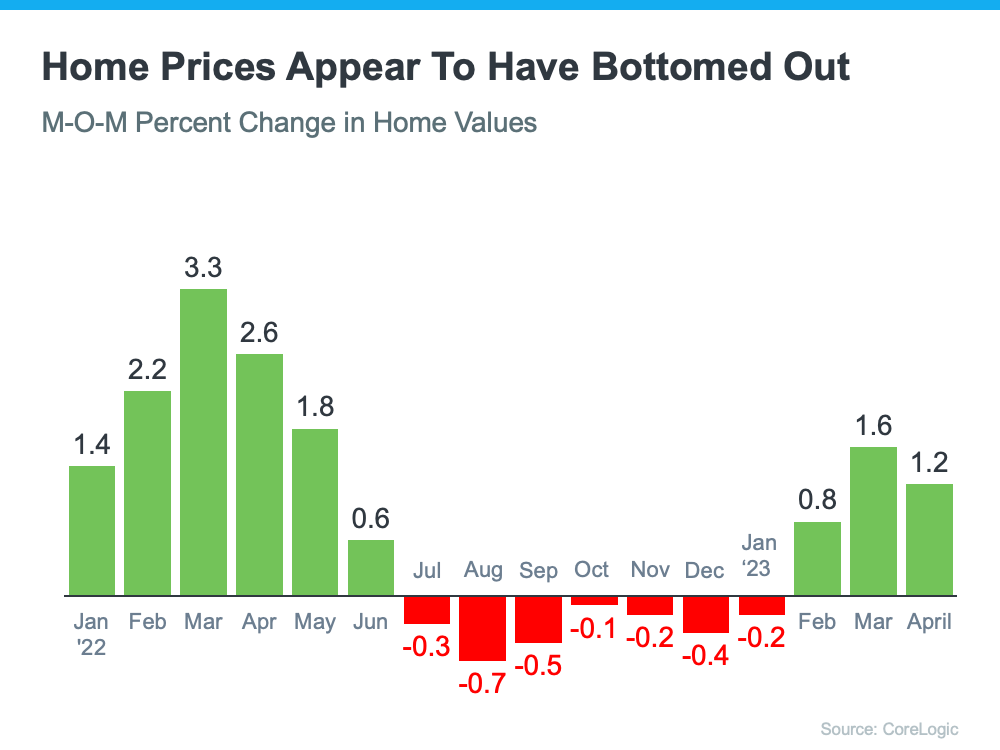
However, on a closer look at M-O-M home prices, we can see prices have actually been appreciating for the last several months. Those M-O-M numbers more accurately reflect what’s truly happening with home values: after several months of depreciation, it appears we’ve hit bottom and are bouncing back.

Here’s an example of M-O-M home price movements for the last 16 months from the CoreLogic Home Price Insights report (see graph below):

Why Does This Matter to You?

So, if you’re hearing negative headlines about home prices, remember they may not be painting the full picture. For the next few months, we’ll be comparing prices to last year’s record peak, and that may make the Y-O-Y comparison feel more negative. But, if we look at the more immediate, M-O-M trends, we can see home prices are actually on the way back up.

There’s an advantage to buying a home now. You’ll buy at a discount from last year’s price and before prices start to pick up even more momentum. It’s called “buying at the bottom,” and that’s a good thing.

Bottom Line

If you have questions about what’s happening with home prices, or if you’re ready to buy before prices climb higher, connect with a local real estate agent.

Comments Off on Are Home Prices Going Up or Down? That Depends…

This Real Estate Market Is the Strongest of Our Lifetime

This Real Estate Market Is the Strongest of Our Lifetime.

When you look at the numbers today, the one thing that stands out is the strength of this housing market. We can see this is one of the most foundationally strong housing markets of our lifetime – if not the strongest housing market of our lifetime. Here are two fundamentals that prove this point. 

1. The Current Mortgage Rate on Existing Mortgages

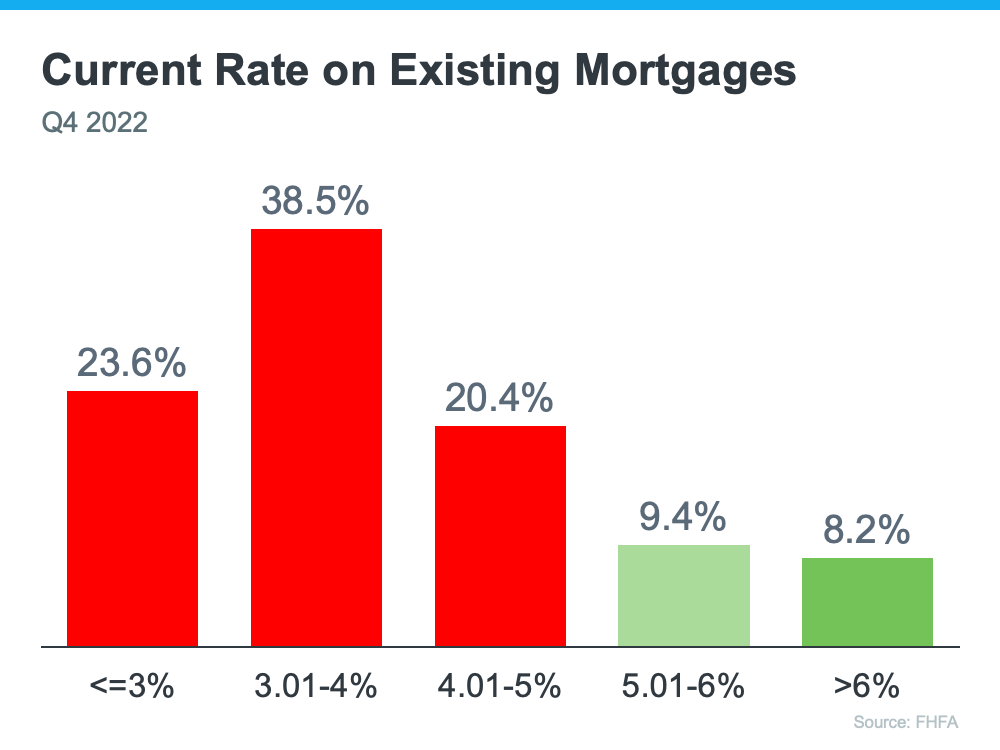
First, let’s look at the current rate on existing mortgages. According to the Federal Housing Finance Agency (FHFA), as of the fourth quarter of last year, over 80% of existing mortgages have a rate below 5%. That’s significant. And, to take that one step further, over 50% of mortgages have a rate below 4% (see graph below):

Now, there’s a lot of talk in the media about a potential foreclosure crisis or a rise of homeowners defaulting on their loans, but consider this. Homeowners with such good mortgage rates are going to work as hard as they can to keep that mortgage and stay in their homes. That’s because they can’t go out and buy another house, or even rent an apartment, and pay what they do today. Their current mortgage payment is more affordable. Even if they downsize, with today’s higher mortgage rates, it could cost more.

Here’s why this gives the housing market such a solid foundation today. Having so many homeowners with such low mortgage rates helps us avoid a crisis with a flood of foreclosures coming to market like there was back in 2008.

2. The Amount of Homeowner Equity

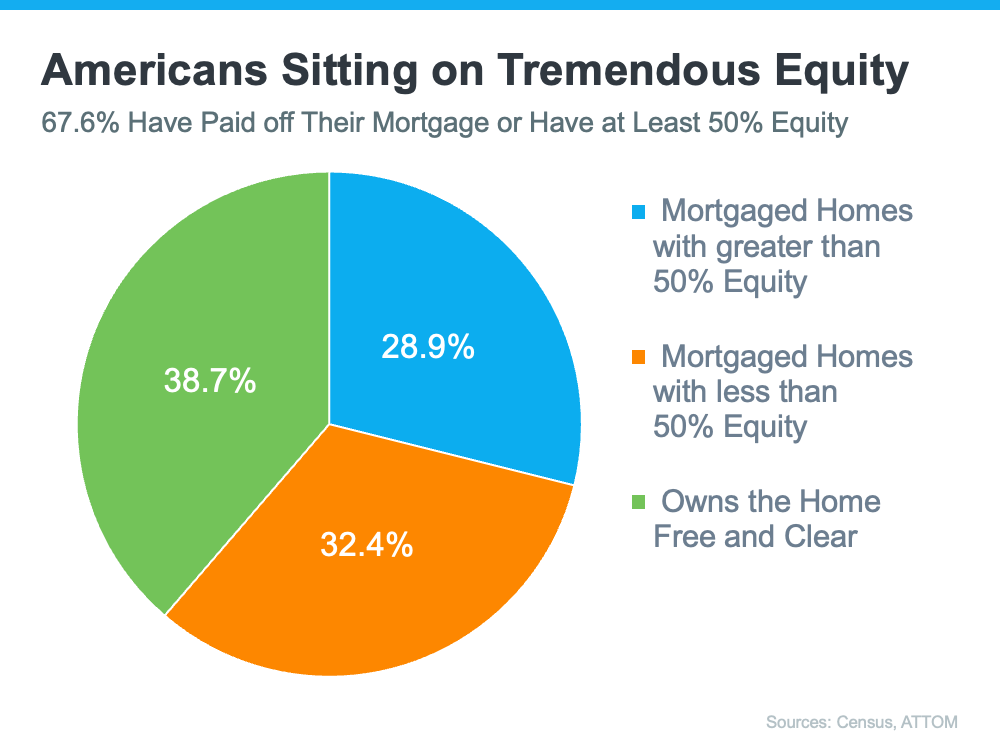
Second, Americans are sitting on tremendous equity right now. According to the Census and ATTOM, roughly two-thirds (around 68%) of homeowners have either paid off their mortgage or have at least 50% equity (see chart below):

In the industry, the term for this is equity rich. This is significant because if you think back to 2008, some people had to make the difficult decision to walk away from their homes because they owed more on the home than it was worth.

But this time, things are different because homeowners have built up so much equity over the past few years alone. And, when homeowners have that much equity, it helps us avoid another wave of distressed properties coming onto the market like we saw during the crash. It also creates an extremely strong foundation for today’s housing market.

Bottom Line

We are in one of the most foundationally strong housing markets of our lifetime because homeowners are going to fight to keep their current mortgage rate and they have a tremendous amount of equity. This is yet another reason things are fundamentally different than in 2008.

Comments Off on This Real Estate Market Is the Strongest of Our Lifetime
Style Selector
Select the layout
Choose the theme
Preset colors
No Preset
Select the pattern